Monitoring and dashboards
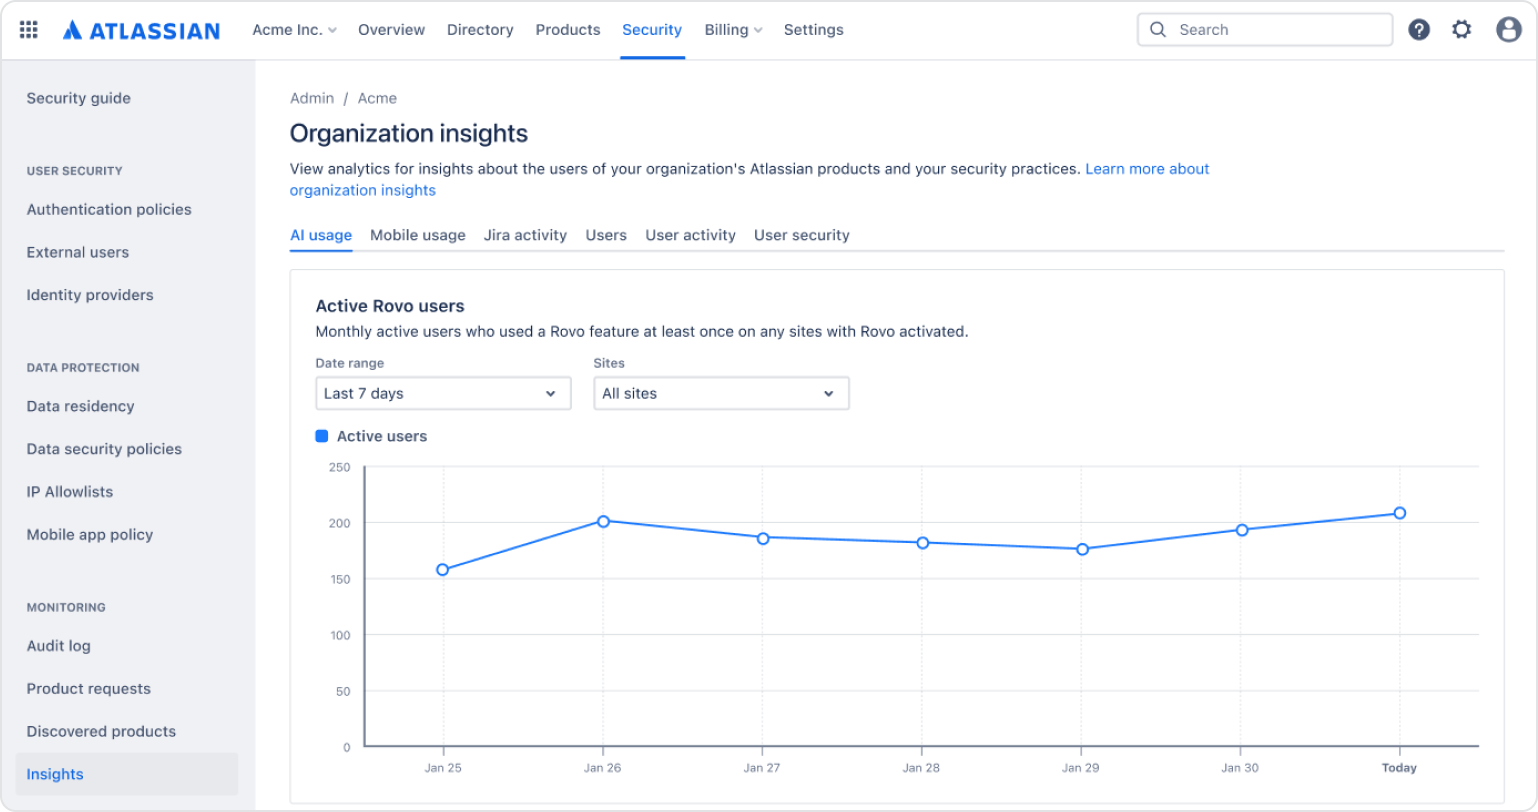
Admin dashboards provide insights into Rovo usage and performance, including metrics like active users and requests sent over different time periods.
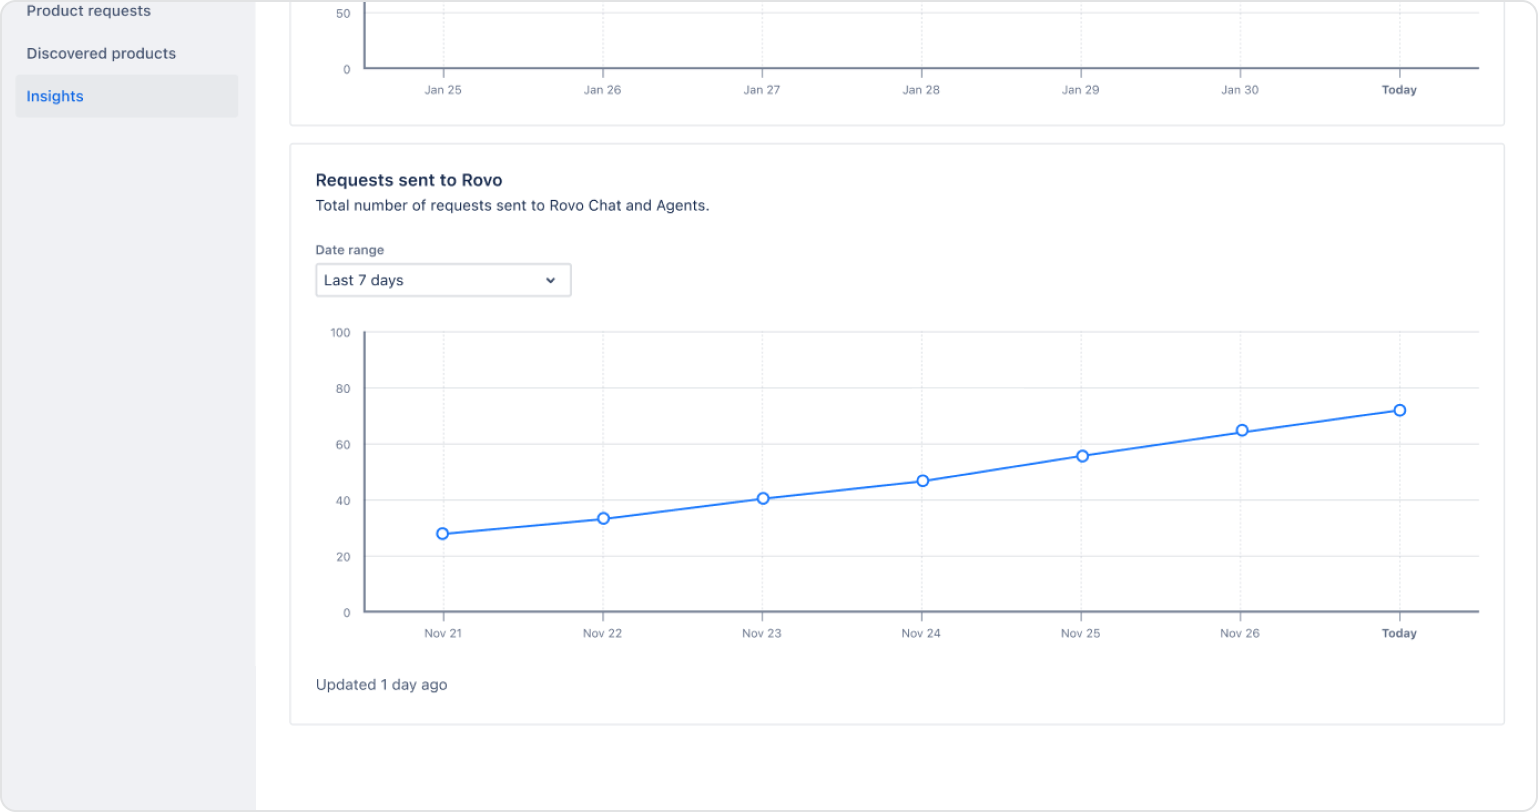
There are currently two charts available.
1. Active Rovo users: Tracks the number of Rovo users by site who have had at least one interaction with Rovo over the past 28 days. Filter by the past week, month, quarter, and year.
2. Requests sent to Rovo: Tracks the number of chat and messages sent to Rovo over the past week, month, and year.

Access Rovo insights
To access your organization's insights:
- Go to Atlassian Administration. Select your organization if you have more than one.
- Select Security > Insights > AI Usage
Note: Rovo Admin actions are accessible to Guard Standard+ customers and Rovo user actions are available to Guard Premium customers.
Additional resources
Explore more with the Cloud roadmap and Rovo community.
Feedback
We would love to hear from you.